Installed on your premises

Everything runs on your premises.

Technician’s photo, analysis engine, rack diagram and documents: a single server, on your network. No photo leaves, no online service is called.

  • On your servers, in containers: photos and results stay on your premises.
  • Delivered compiled, under license; every release is signed and verified at installation.
  • Access by account, created by the administrator; the services called are checked and displayed.
Engine and on-premises AI

One photo. The whole rack, read on your premises.

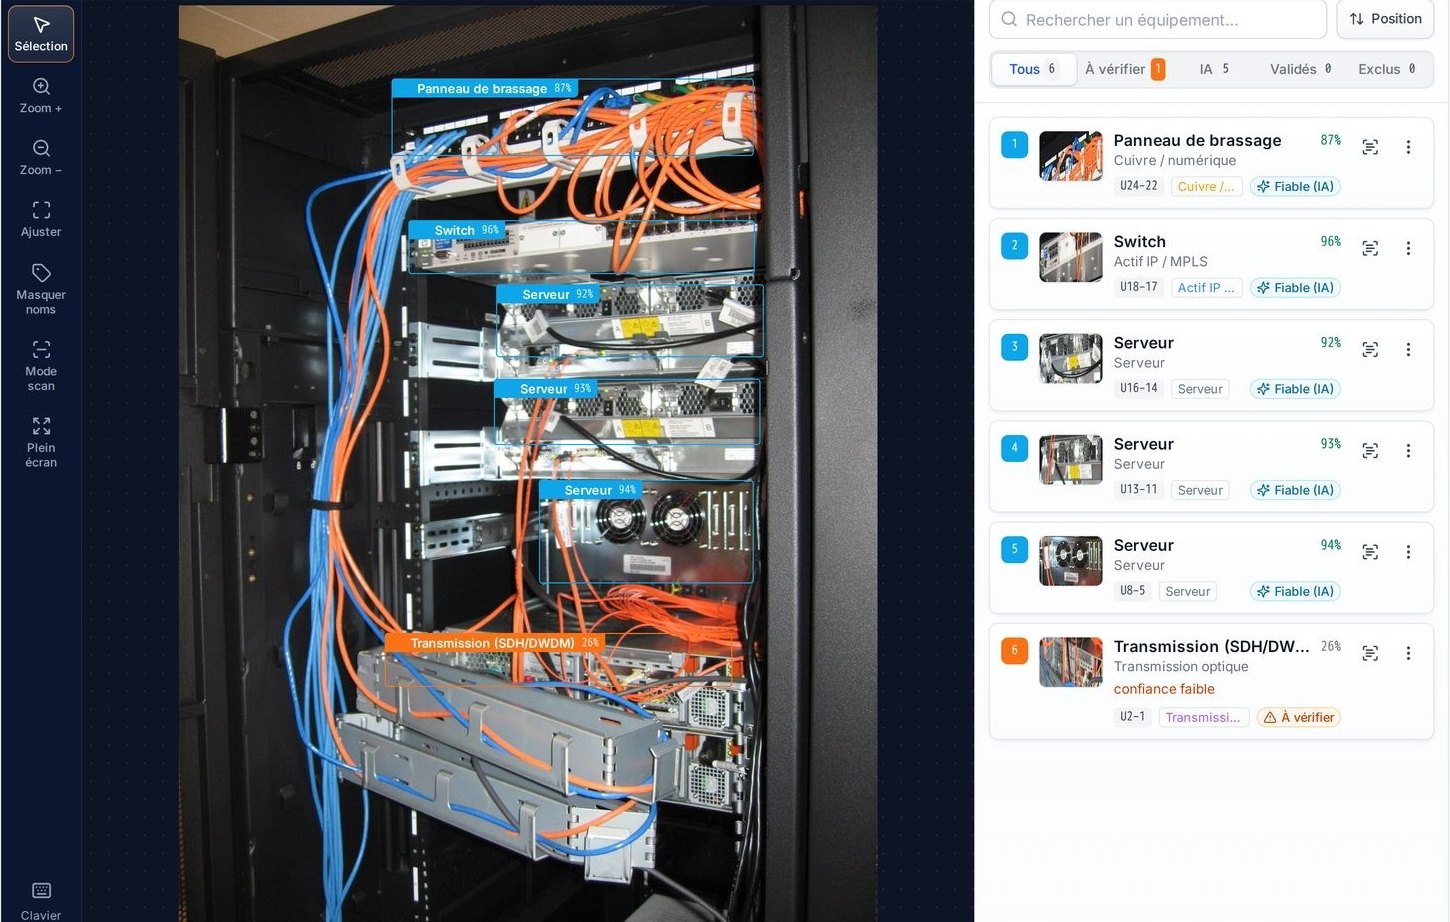
Every device is located, sorted into its family, placed by U and given a confidence level. Below the threshold you set, it is marked “to check”: an uncertain result is never presented as certain.

  1. Photo receivedon your server, nowhere else
  2. Local analysisfamily, U position, confidence
  3. Doubts flaggedbelow your threshold: “to check”
  4. Diagram and documentsU positions, PowerPoint, CSV

Rack diagram

The rack, U by U, ready to export.

The diagram is built from the photo: every device in its position, free U counted. Set the bottom U, choose the face, move a device by drag and drop, then export.

Projects and documents

From site to report, in a few clicks.

Group a site’s photos in a project and analyze them together. The PowerPoint report, the inventory for Excel and the diagram of each rack come straight out of the analysis.

project · photos, analysis, documents

One project per siteseveral photos, analyzed together

  1. Photo 1
  2. Photo 2
  3. Photo 3

Export the resultfrom the analysis, in one click

  • PowerPoint · Site reportsummary, one slide per photo, editable elevation
  • CSV · Inventoryone line per device, opens in Excel
  • SVG · draw.io · Rack diagramU elevation, aligned with the real rack

An accurate inventory, without spending your days on it.

Rack surveys remain the blind spot of inventories: site visits, paper, re-keying. Here is the same survey with RackIntelligence, from the photo to the documents, without anything leaving your network.

Without RackIntelligence Site visit to surveyPaper survey, U by UReturn to site to completeRe-keying into a spreadsheet
Your network · your servers

The technicianone photo per rack

RackIntelligence server on your premises · in containers Photo received

Analysis resultrack A07

  • U39Copper patching98%
  • U37IP equipment92%
  • U33Server97%

reviewed on screen · the photo alongside

Documents readyreport, inventory, diagram

Internetnothing leaves
  • Fewer site visitsone photo per rack is enough
  • No more re-keyingthe inventory comes out as CSV, ready for Excel
  • A shareable recordPowerPoint report and rack diagram
  • Data on your premisessigned releases, access by account

Why RackIntelligenceData securityComparable with the CSV or Excel export of your inventory.

The engine

It reads the rack like a technician.

Every device is located on the photo, sorted into its family and given a confidence level. The engine runs on your servers: photos do not leave.

Reading the photo…
0devices
0families
—average confidence

    Public demo photos; boxes, families and confidence scores are those returned by the engine, as displayed by the platform.

    Rack diagram

    From photo to diagram, U by U.

    Every device located on the photo takes its place in an elevation graduated in U, with its family and confidence. You align the diagram with the real rack, correct a position if needed, then export it.

    1Photo read 2U positions 3Diagram ready to export
    Photo · front face
    Front photo of demo rack A07, devices boxed as they are read
    Diagram · rack

      Devices placed 0

      • Photographed faceFront
      • Rack height42 U
      • A wrong position?Drag and drop

      Export the diagramas SVG, or as a draw.io file that draw.io can convert for Visio

      Real engine result on demo rack A07: boxes, families, confidence scores and U positions, as displayed by the platform.Open the platform

      Aligned with the real rack

      Bottom U, rack height, front or rear face: the diagram follows the rack you photographed.

      Corrected before export

      A drag and drop moves a device; free areas spotted on the photo count as free U.

      Exported in one click

      SVG for your documents, draw.io for your plans; the elevation also appears in the PowerPoint report.

      CMDB reconciliation

      Your inventory, side by side with what the photo shows.

      Drop the export of your inventory, as CSV or Excel, onto an analysis: the platform matches it against the detected devices and separates what agrees from what is missing, on either side. Your file is never modified.

      1. Export your inventoryas CSV or Excel (.xlsx), as your tool produces it
      2. Drop it onto the analysis“CMDB reconciliation” tab, up to 25 MB
      3. Read the resultmatching by the model read on the photo, then by category

      CMDB reconciliationyour official inventory, side by side with the detected devices

      CMDB linesthe devices declared in your file
      Matchedseen on the photo and present in the file
      Missing on sitein the file, not seen on the photo
      Missing from the CMDBseen on the photo, missing from the file

      A model that cannot be read on the photo is compared by its category. “Missing on site” is a prompt to look more closely: the device may be hidden, or mounted on the other face of the rack.

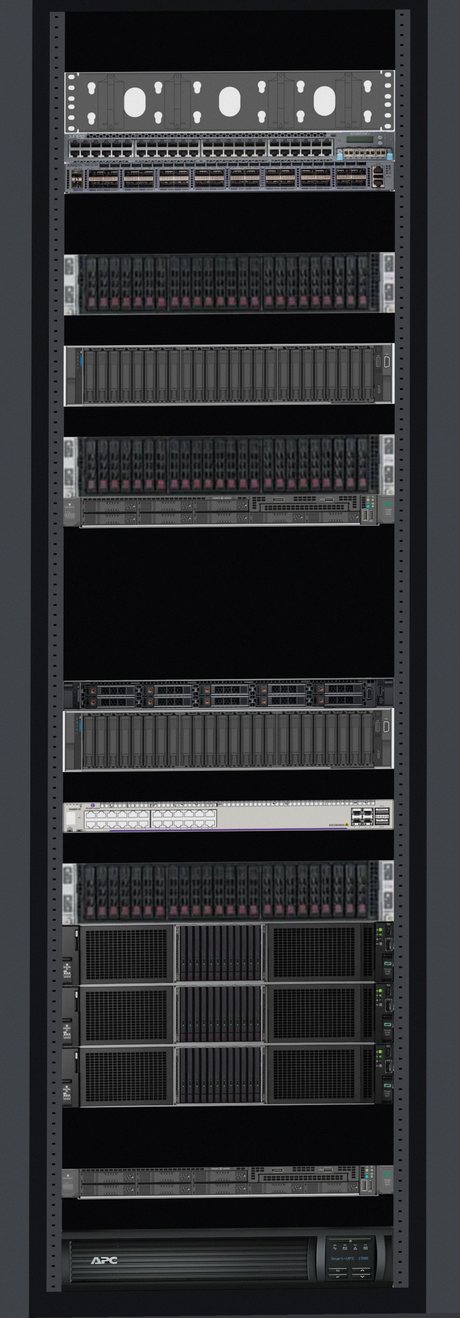
      The equipment the platform recognizes

      Each detection carries its family, its position and its confidence level.

      Unbranded 3D illustrations. Hover over a card: front view, as the photo shows it to the engine.

      From rack to report

      The technician photographs the rack from a phone, directly in the platform. At the office, the analysis, the diagram and the documents are waiting, with the photo next to each device.

      Sign in to the platform

      Stay in touch

      New releases, newly recognized equipment, articles: an email when there is something new, nothing else.