Documents
Documents and exports
A committee, a customer, a field team: each needs to see the actual state of the racks. RackIntelligence produces the documents from the analysis of your photos, with no manual layout.
Contents
Three exports, from the analysis
On an analysis screen, the menu Export offers the report and the inventory; the Rack diagram exports the elevation:
- PowerPoint report : the site summary, ready to present.
- CSV / Excel inventory : one line per device.
- SVG or draw.io diagram : the rack elevation, graduated in U.
The site’s PowerPoint report
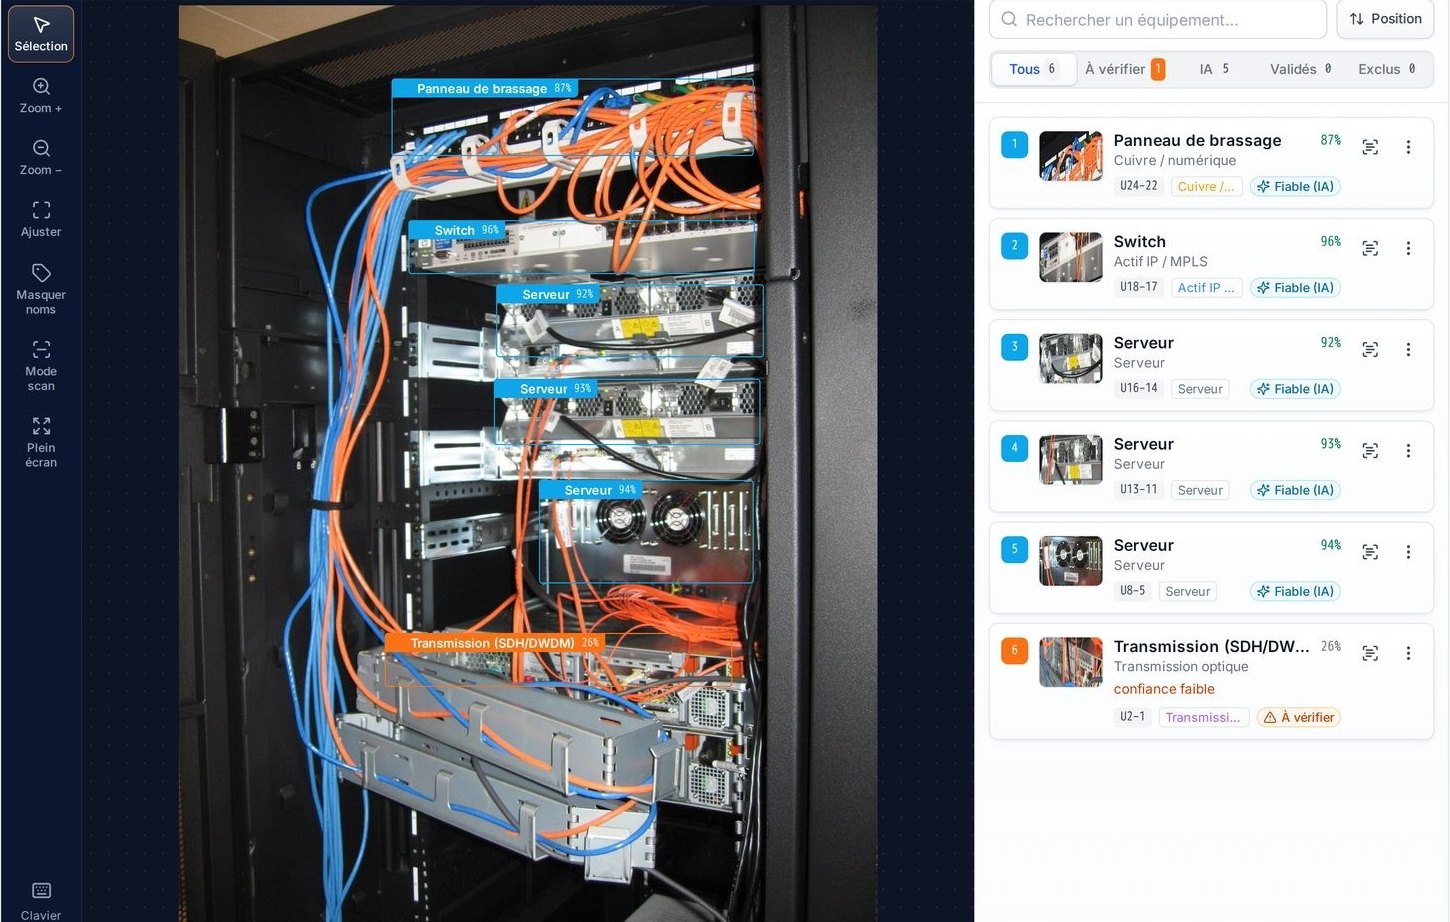
The report covers all the photos in the analysis: a title slide, a site summary (number of devices, number to check, breakdown by family), then, for each photo, the annotated image with its inventory and the rack elevation drawn in PowerPoint shapes, which you can edit. It can also be downloaded from the project page, analysis by analysis.
The inventory, one line per device
The CSV file gives, for each device: the site, the photo, the family, the model when it was read, the confidence and the “to check” flag. It opens directly in Excel, accents included, and can be compared with or imported into your tools. The project page gathers the inventory of all its analyses.
The rack diagram
The elevation is built from the photo: devices in their position, free U, power strips. Before export, you adjust it to the real rack (height, bottom U, front or rear face) and a drag and drop corrects a position. The SVG fits into documentation; the button “draw.io / Visio” produces a draw.io file, in which the diagram can be freely edited.
Without leaving your network
The documents are produced on your server, from the analysis result: nothing is re-keyed, and no photo or inventory data is sent to an external service. What is marked “to check” stays that way in the exports.