Why RackIntelligence
An accurate inventory, without spending your days on it
Rack surveys remain the blind spot of inventories: paper, re-keying, omissions. RackIntelligence turns them into a photo, an analysis and a review, on your servers.
Contents
A photo instead of a manual survey
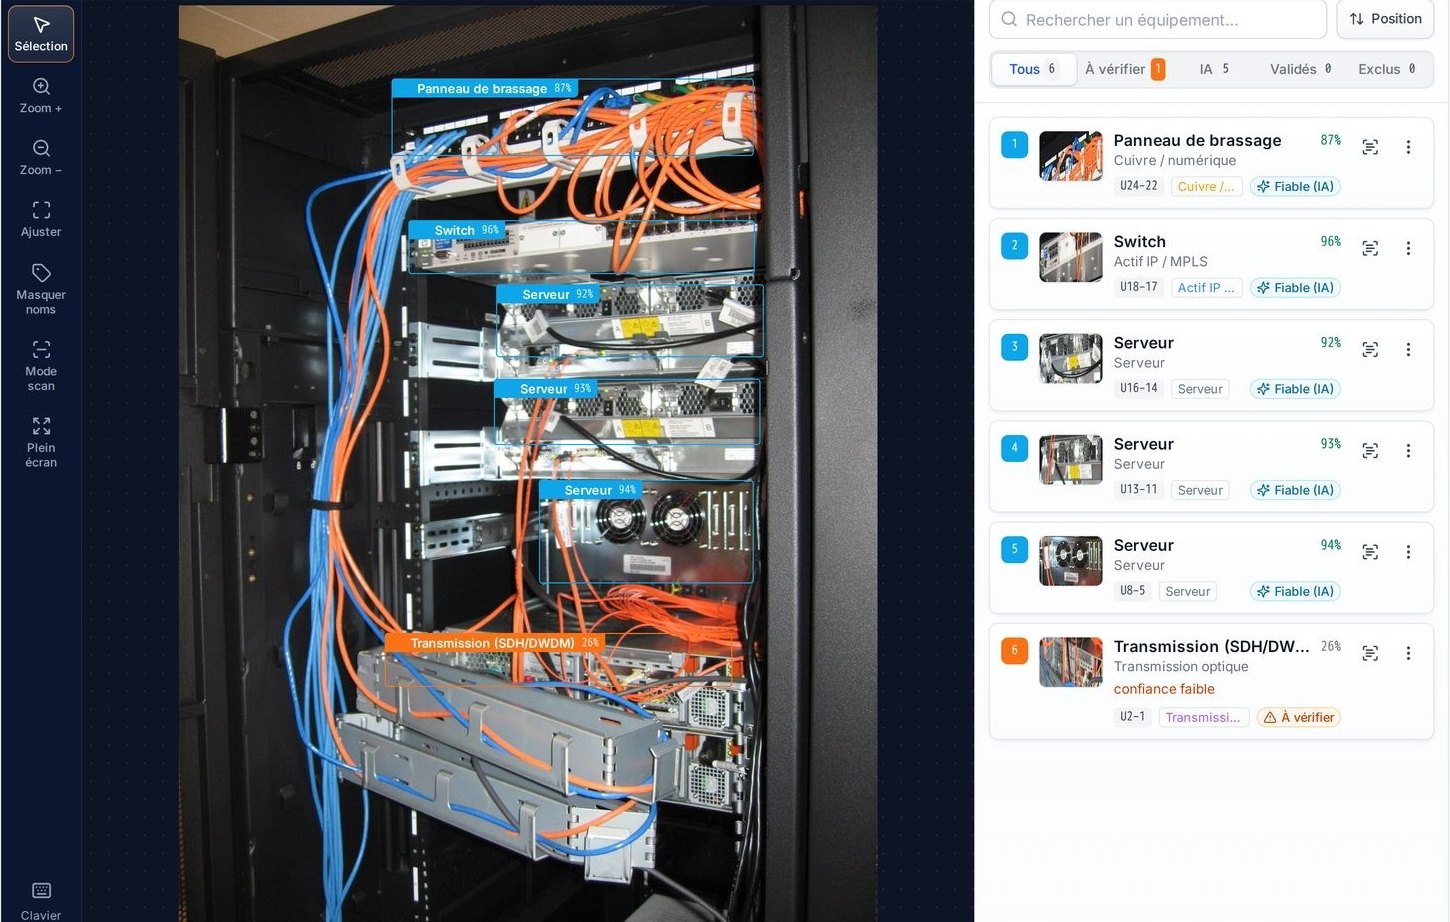
Surveying a rack by hand means noting each device U by U, going back to the office, re-entering it in a spreadsheet and redrawing the diagram. With RackIntelligence, the technician takes a photo; the engine identifies each device, sorts it into its family and places it in U. Whatever it is not sure about is marked “to check”.
Manual survey
What most teams go through today
- Note each device on paper, U by U
- Take photos “just in case”
- At the office, sort the photos and reread the notes
- Re-keying into a spreadsheet
- Redrawing the rack diagram
Result: an inventory and a diagram already out of date the next day.
With RackIntelligence
The same survey, with the photo as evidence
- Photograph the rack, or import several photos at once
- Review the list: each device, its family and its U position, doubtful cases marked “to check”
- Export the inventory, the diagram and the site report
Result: an inventory and a diagram ready the same day.
What you save
The gain is not only in survey time: it shows wherever information used to be copied or redrawn.
Travelreturn visits
An incomplete or unreadable survey means coming back.
The result can be read before leaving the room: if an area is missing, you retake a photo on the spot.
Re-keyingpaper → spreadsheet
Notes are copied line by line.
The inventory comes out as CSV or Excel, one line per device.
Diagramsrack drawing
The elevation is redrawn by hand.
The diagram comes out as draw.io and SVG, ready to edit.
Searchesfind a survey
Photos and files scattered across folders.
Each analysis is filed in its site’s project and can be reopened from the history.
Your gain, with your figures
Enter your own values: the calculation runs in your browser and nothing is sent.
To estimate the time with RackIntelligence, count taking the photo, the analysis (less than a minute per photo on our bench, a server without a graphics card; up to two minutes if label reading is requested) and reviewing the discrepancies.
Your data stays with you
RackIntelligence is installed on your servers. Your rack photos and analysis results do not leave your network.
- On your serversInstalled in containers, on your network.
- On-site analysisNo photo or result sent outside.
- Signed releasesEach release is verified at installation.
- Named accountsCreated by an administrator, with sessions that expire.
- Nothing is written on your sideThe platform produces results and files; a person reviews them.
- No online subscriptionA license installed on your premises.
Details are on the Data security page and in the Trust center.
Compare with your CMDB
Upload a CSV or Excel export of your inventory to an analysis: the platform compares it with the devices seen on the photos.
Matched
In your CMDB and seen in the photo.
Nothing: the inventory is correct.
Missing on site
In your CMDB, but not seen on the photo.
Check: removed, moved, or outside the photo frame.
Missing from the CMDB
Seen on the photo, but not in your file.
Add to your tool after review.
Matching is done by model read, then by family. Your inventory is never modified: you know what to correct, and you do it in your tool.
A rack diagram true to the photo
Each analysis gives an elevation graduated in U, with free U and power strips. You align it with the actual rack (height, bottom U, front or rear face), and drag and drop corrects a position before export.
The actual state, ready to share
Documents produced from the analysis, with no manual layout:
- PowerPoint : site report, with summary, annotated photo and inventory of each rack.
- CSV / Excel : the inventory, one line per device.
- SVG and draw.io : the rack diagram, to embed or retouch.