Field
Surveying a rack in five minutes with a photo
One front photo, taken with a phone, is enough to get the list of devices in a rack, their U position and their family. Here is how to go about it, step by step.
Contents
Surveying a rack by hand means a notebook, a flashlight and many trips back and forth between the front of the rack and the sheet. You note a device, count the U, count again because a cable manager made you skip a line. Photo surveying reverses the logic: you take a picture of the whole rack, the platform proposes an inventory, and you keep your attention for what really needs a human eye.
This article describes the method as it works today, from taking the photo to export. The five minutes in the title are not a quantified promise: they are the order of magnitude of a simple action, a photo then a review, compared with a full manual survey. The actual time depends on the rack, its lighting and the number of points to check.
What you get at the end
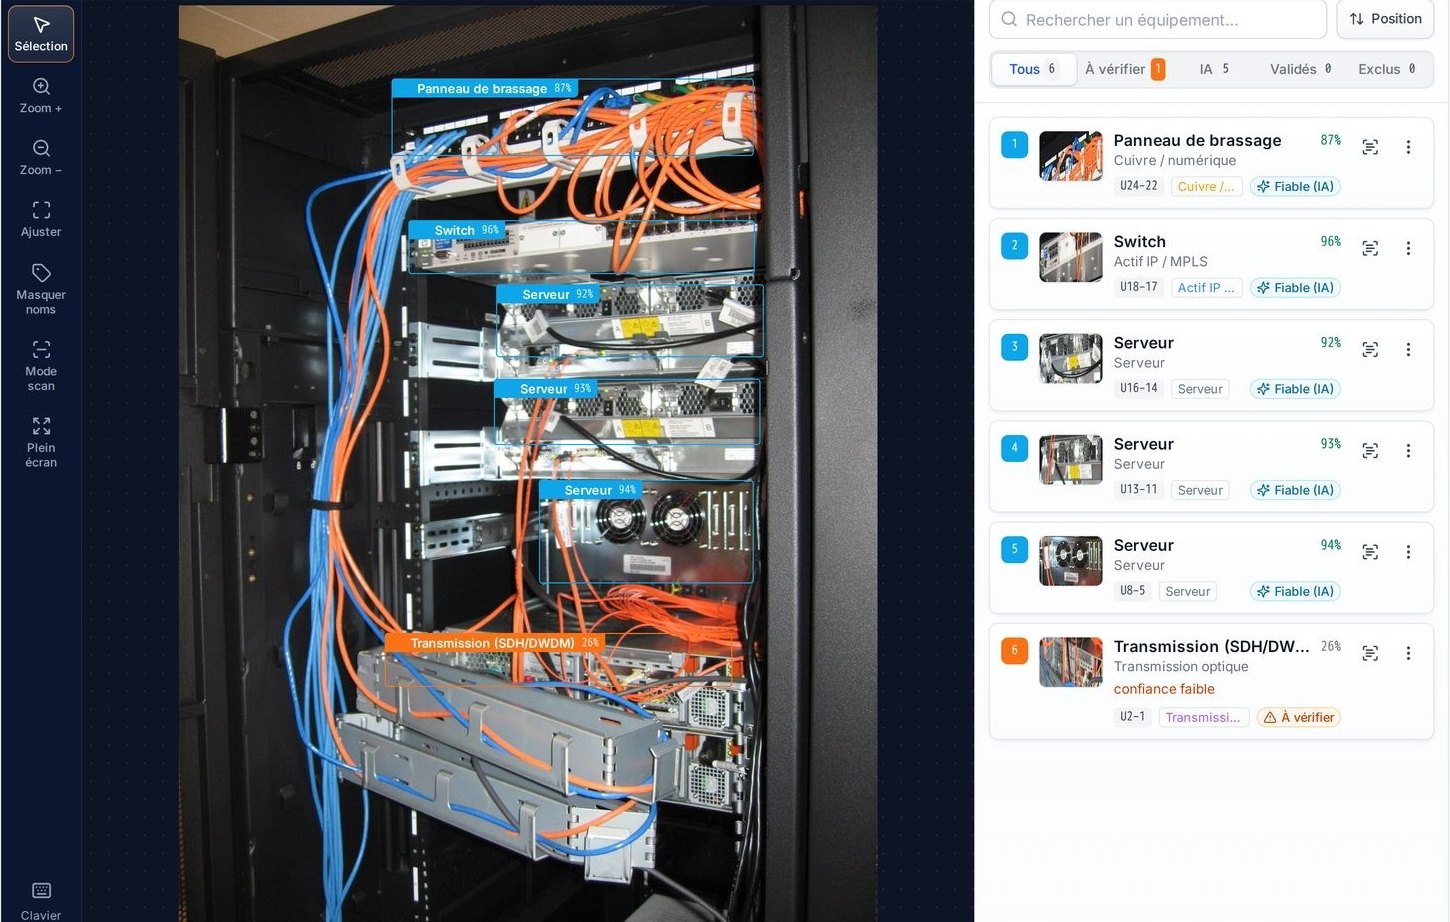
For each device spotted in the photo, the platform returns four pieces of information:
- a box on the photo, showing exactly what was seen;
- a family : network, fiber and transmission, power, server, patching and other;
- a U position, calculated from the rack rails;
- a confidence level, shown as a percentage next to each line.
When the front panel allows it, the device model is also shown. Each box on the photo corresponds to a line in the list: you always know what is being referred to. At the top of the result, a summary gives the number of devices identified, the number of lines to check and the breakdown by family.
Before taking the photo
The quality of the survey is largely decided when the photo is taken. A few simple rules are enough.
The whole rack, from the front
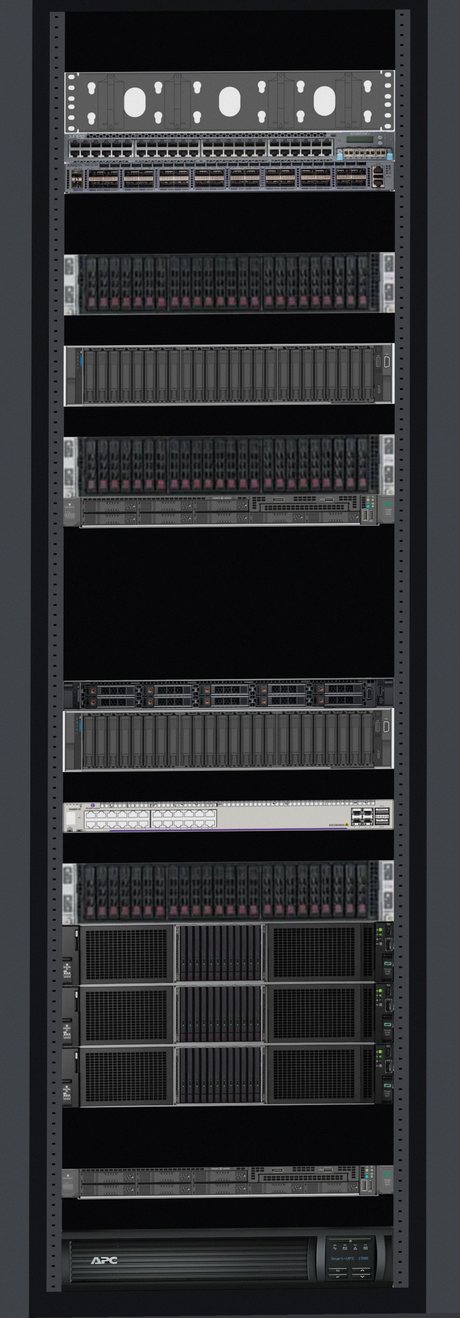
The engine relies on the rack rails to place each device in U. It therefore needs to see the rack from top to bottom, from the front, without cutting off the top or the bottom. Step back rather than closer: a slightly wide photo is better than a cropped one.
One door open, one face at a time
Open the front door if it is solid or glazed with reflections. A photo shows one face: what is at the rear does not appear in it, and you will indicate on the rack diagram which face was photographed. If you are interested in the rear, take a second photo and add it to the analysis.
Light, no blur
In rooms, aisles are often dark. Turn on the aisle lighting or use the phone’s flashlight. Hold the device straight and wait for focus before shooting.
The survey steps
Open or create a project
Each analysis is filed in a project, which generally corresponds to a site. From the “Import & analyze” screen, choose an existing project or create one.
Take or import the photo
From a phone, the browser opens the camera directly: you photograph the rack without going through the gallery. At the office, drag and drop one or more photos at a time, or start from the input folder provided on the server.
Let the analysis run
The analysis runs on your server: the photo is not sent to any online service. The default engine is set by the administrator, and you can choose another one at launch. The equipment appears boxed, with its family and position.
Review the “to check” lines
Start with the lines marked “to check”. For each one, compare the box with the photo, zoom in if needed: this is where your eye matters most.
Align the diagram, then export
Check the rack diagram built from the photo, align it with the actual rack, then export the site report, the inventory or the diagram.
Reading confidence correctly
The percentage shown next to each device indicates how sure the engine is of its detection. It is neither a quality rating of the hardware nor a guarantee: it is a signal to guide your review.
When confidence is low, the platform neither hides the detection nor presents it as certain. It marks it “to check”, with a readable reason, for example “low confidence”. This is a deliberate choice: a visible line of doubt is better than a silent error in the inventory.
The threshold below which a device goes to “to check” is set by the platform administrator and applies to all analyses. The search and filters of the list help you go fast: an efficient review consists of handling the lines to check first, then quickly going through the others while looking at the photo.
Align the diagram before exporting
From the photo, the platform draws the rack elevation, graduated in U: each device in its place, free U clearly visible, vertical power strips set apart as 0 U devices. Before exporting it, take a minute to align it with the actual rack:
- enter the number of the bottom U, if the rack numbering does not start at 1;
- specify the rack height, in U;
- choose the photographed face, front or rear;
- if a device is offset, drag it to its correct position.
These adjustments apply to the diagram you export: they change neither the photo nor the analysis result. If an area was poorly visible, add a complementary photo to the analysis rather than starting over.
The “Read labels” button also attempts to read the labels visible on the front, on your server. Its result depends heavily on the photo: treat it as an aid, to be reviewed like the rest.
What next?
A reviewed survey can be used in several ways:
- The site report, in PowerPoint: a summary of the site, then one slide per photo with the annotated image and its inventory, and the rack elevation as editable shapes.
- The inventory, in CSV or Excel: one line per device, with the site, the photo, the category, the model, the confidence and the “to check” flag. The analyses of a project also feed the inventory of the whole project.
- The rack diagram, in SVG or draw.io format, to reuse it in your drawing tools.
- The comparison with your CMDB : drop an export of your inventory, in CSV or Excel, onto the analysis. The platform matches the detected equipment with the lines of the file, by the model read then by category, and highlights what is in the CMDB without having been seen, and what was seen without being in the CMDB. Your inventory is never modified.
The content of each document is described in Documents and exports.
Want to see what the method gives on your own racks? Request a demo : a few photos are enough to judge.